Display (display)#
Description#
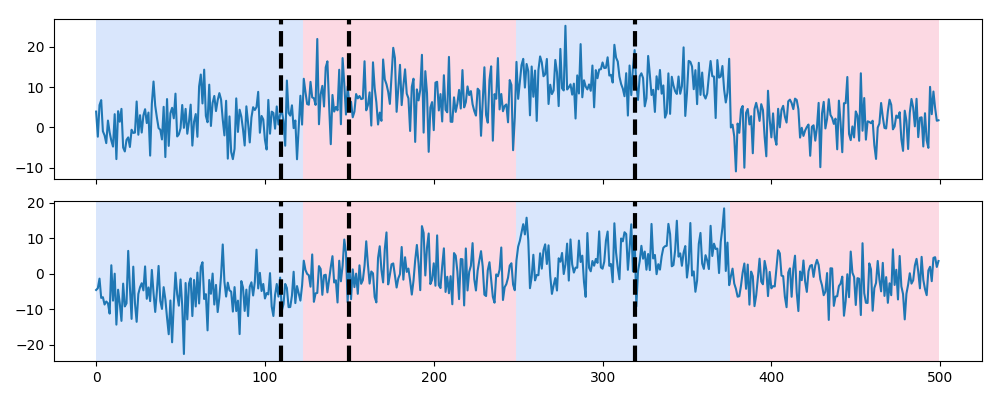
The function display displays a signal and the change points provided in alternating colors.
If another set of change point indexes is provided, they are displayed with dashed vertical dashed lines.
Usage#
Start with the usual imports and create a signal.
import numpy as np
import matplotlib.pylab as plt
import ruptures as rpt

# creation of data
n, dim = 500, 2  # number of samples, dimension
n_bkps, sigma = 3, 5  # number of change points, noise standart deviation
signal, bkps = rpt.pw_constant(n, dim, n_bkps, noise_std=sigma)
rpt.display(signal, bkps)
If we computed another set of change points, for instance [110, 150, 320, 500], we can easily compare the two segmentations.
rpt.display(signal, bkps, [110, 150, 320, 500])

display.