Piecewise sinusoidal signal (pw_wavy)#
Description#
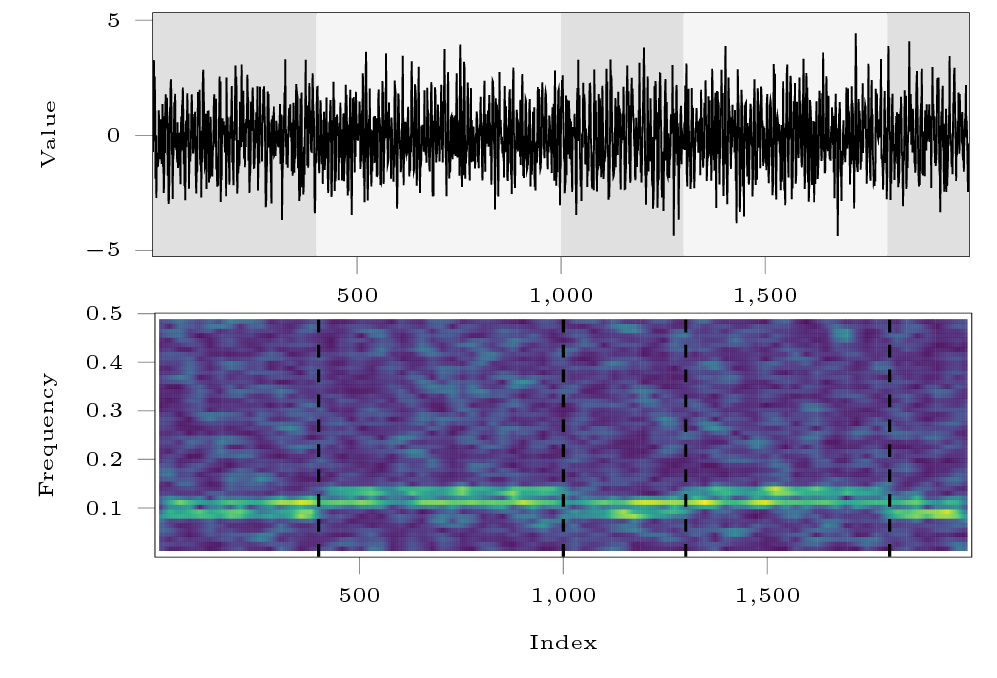
The function pw_wavy simulates a sum-of-sine signal \(y_t=\sin(2\pi f_1 t)+\sin(2\pi f_2 t)\) where \(t=0,\dots,T-1\).
The frequency vector \([f_1, f_2]\) alternates between \([0.075, 0.1]\) and \([0.1, 0.125]\) at each change point index.
Gaussian white noise can be added to the signal.
Usage#
Start with the usual imports and create a signal.
import numpy as np
import matplotlib.pylab as plt
import ruptures as rpt

# creation of data
n, dim = 500, 3  # number of samples, dimension
n_bkps, sigma = 3, 5  # number of change points, noise standart deviation
signal, bkps = rpt.pw_wavy(n, n_bkps, noise_std=sigma)
rpt.display(signal, bkps)